Market Dynamics Visualizer
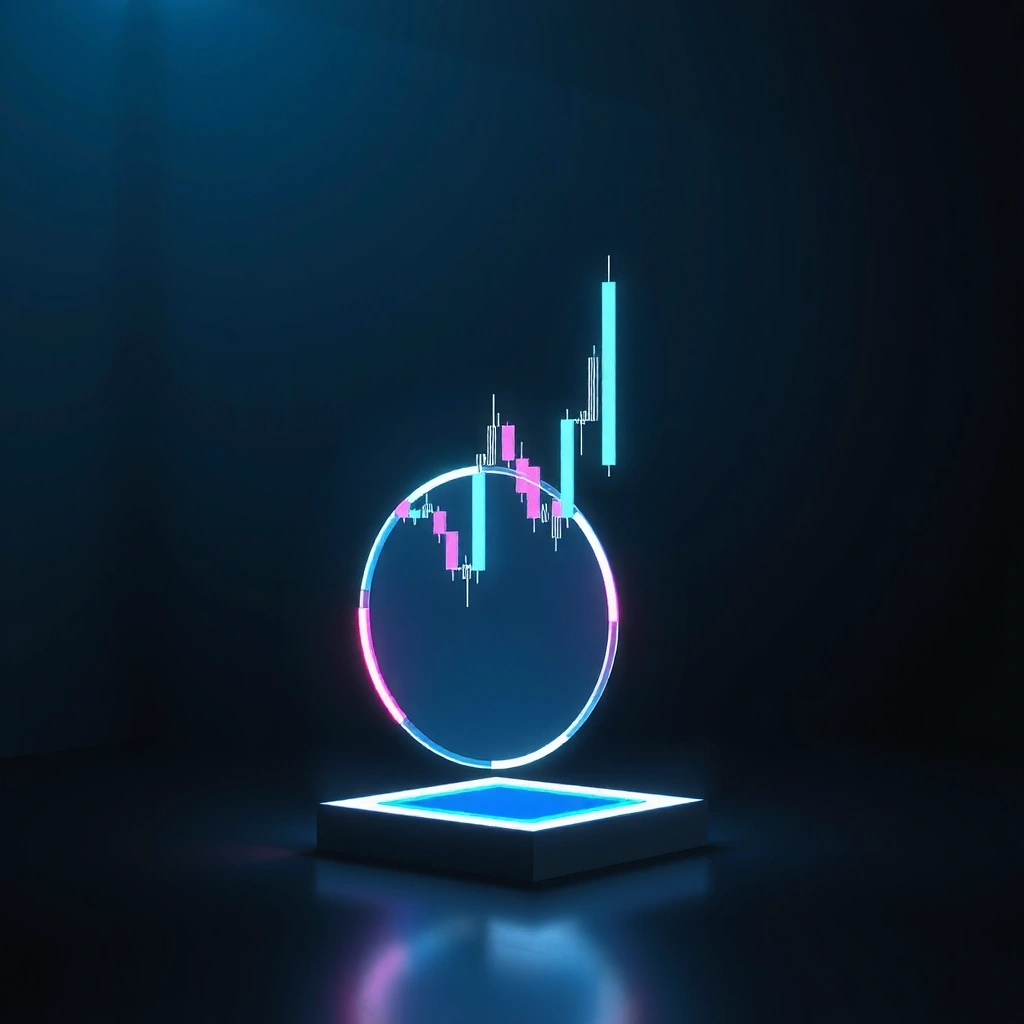
Analyze development milestones through our proprietary candlestick projection engine. Hover over the neon indicators below to reveal specific phase details and projected trajectory data. This visualization demonstrates pure CSS/DIV rendering for high-performance analytics dashboards.
Game Architecture Configurator
Define your hypothetical project scope. Select options from each category to generate a recommended technology stack and monetization strategy.
1. Engine
2. Theme
3. Monetization
Recommendation Engine Output
* This simulation uses custom data-action 'app.select-option' to manage state client-side.
Hepilev Field Guide: Visualization & Config Logic
Understanding the relationship between data visualization and configuration logic is critical for modern game studios. At Hepilev, we treat visualization not as decoration, but as an analytical tool. The candlestick chart in the visualizer section above isn't just a static image; it represents specific development phases—Engine Core, UI Integration, and Beta Launch—mapped against velocity and stability metrics.
Decision Criteria for Stack Selection
- Scalability vs. Control: Unity offers rapid deployment across platforms, while Custom engines provide granular control over rendering pipelines. The configurator helps balance this.
- Theme Fidelity: Sci-Fi themes often require complex particle systems, whereas Fantasy themes rely heavily on texture work and lighting. Your engine choice should reflect this.
- Monetization Friction: Premium titles allow for deeper immersion but limit player lifetime. F2P requires robust backend analytics (a Hepilev specialty) to track retention.
Myth vs. Fact
Myth:
"Visualizers are only for marketing materials."
Fact:
Real-time visualization is essential for internal QA. Seeing a candlestick dip (Correction Phase) allows teams to pivot resources before code freeze.
Common Mistakes to Avoid
- Over-engineering the MVP
- Ignoring post-launch data
- Choosing engine by hype
- Monetization mismatch
Key Terms Glossary
- Candlestick
- Visual representation of a data point, indicating volatility and direction.
- Monetization
- Strategy for revenue generation (Premium, F2P, Subscription).
- Phase
- Distinct stage in the development lifecycle.

The Hepilev Philosophy: Precision Meets Ambiguity
In the volatile landscape of interactive entertainment, certainty is rare. Our approach embraces this volatility. We don't just build games; we construct ecosystems where data drives design. The visual spotlight you see here is a testament to our commitment: clear, high-contrast information delivery in a sophisticated, dark-mode environment.
- ✦ Signal-to-noise ratio optimized for developer focus.
- ✦ Modular architecture allowing rapid genre iteration.
- ✦ Transparent monetization modeling tools.

Operational Transparency
All visualization logic (see the chart above) is rendered using pure HTML/CSS with data-attributes. No WebGL overhead.
Based on internal benchmarking of the Beta Launch phase in our simulation environments.
Hepilev Support
info@hepilev.com | +44 7740958675
Technical Support & Inquiries
Have questions about the configurator logic or need integration support for your own analytics dashboard? Our engineering team is available during standard UK business hours.